


Water is our Mission
Water
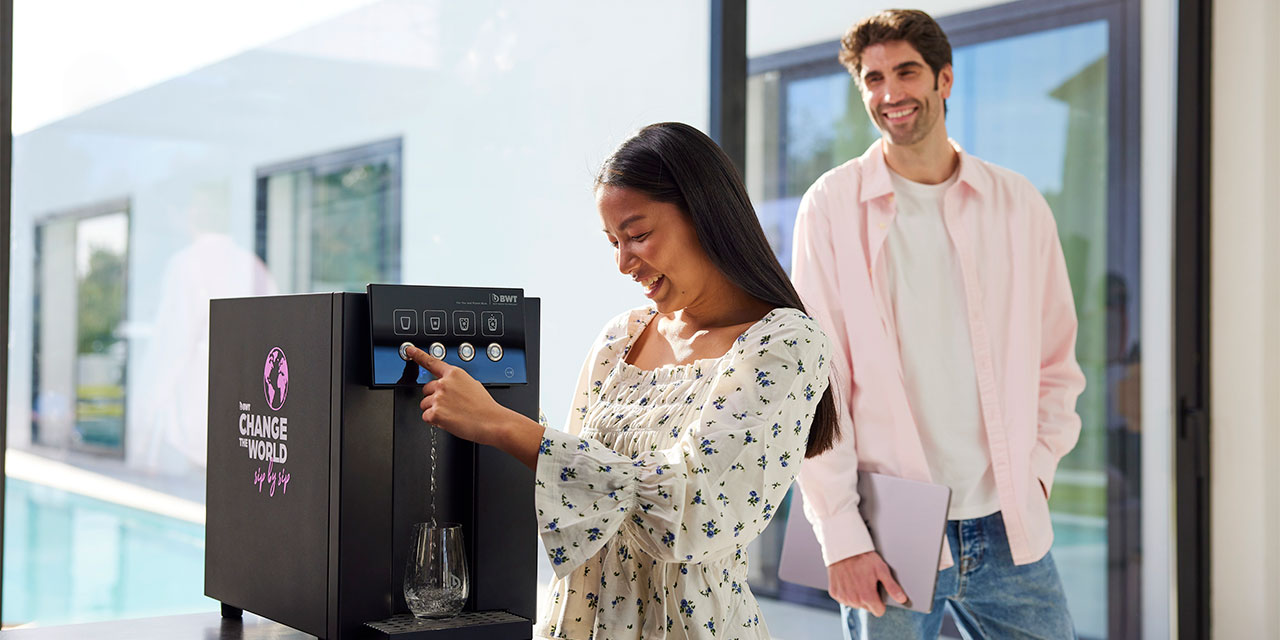
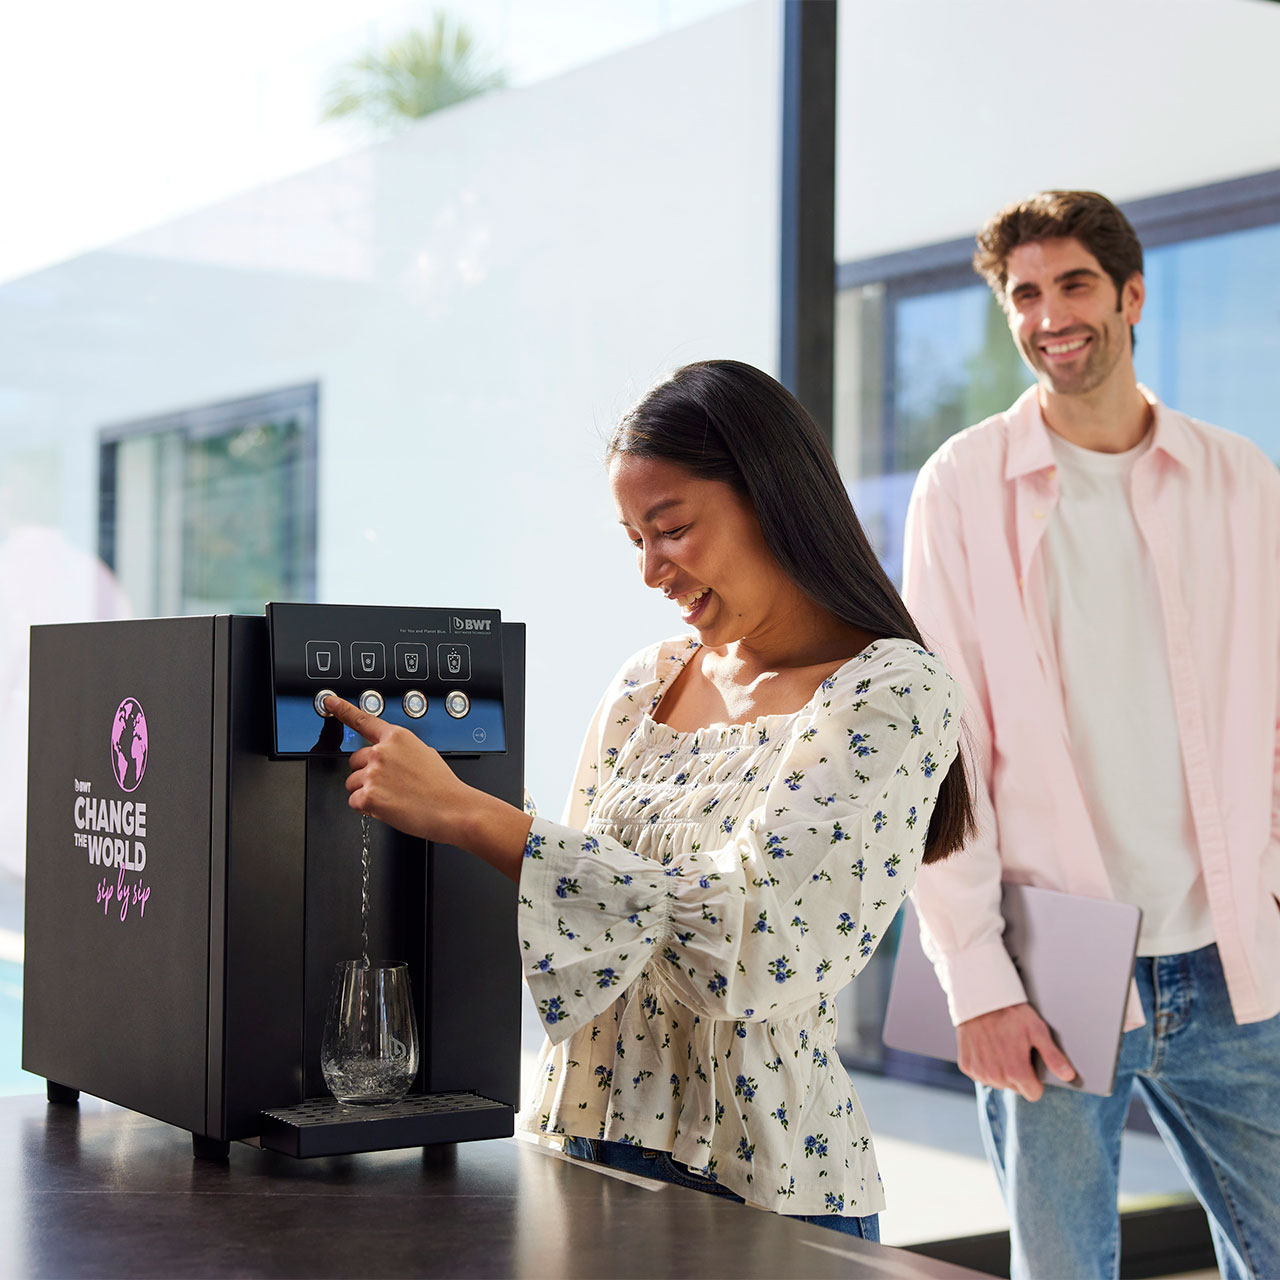
BWT - For You and Planet Blue.
Water is both the elixir of life and a limited resource, but it is not always available at the quality level required. BWT has therefore set itself the task of treating existing water on site, to make it available at the desired quality. We are committed to working sustainably, conserving the precious resources of our blue planet.
Our world-beating expertise, innovative technologies and high-quality products enable us to supply optimum water quality to all sectors and environments, and to ensure the highest level of safety, hygiene and health in our daily contact with water, the elixir of life.
Our world-beating expertise, innovative technologies and high-quality products enable us to supply optimum water quality to all sectors and environments, and to ensure the highest level of safety, hygiene and health in our daily contact with water, the elixir of life.
News

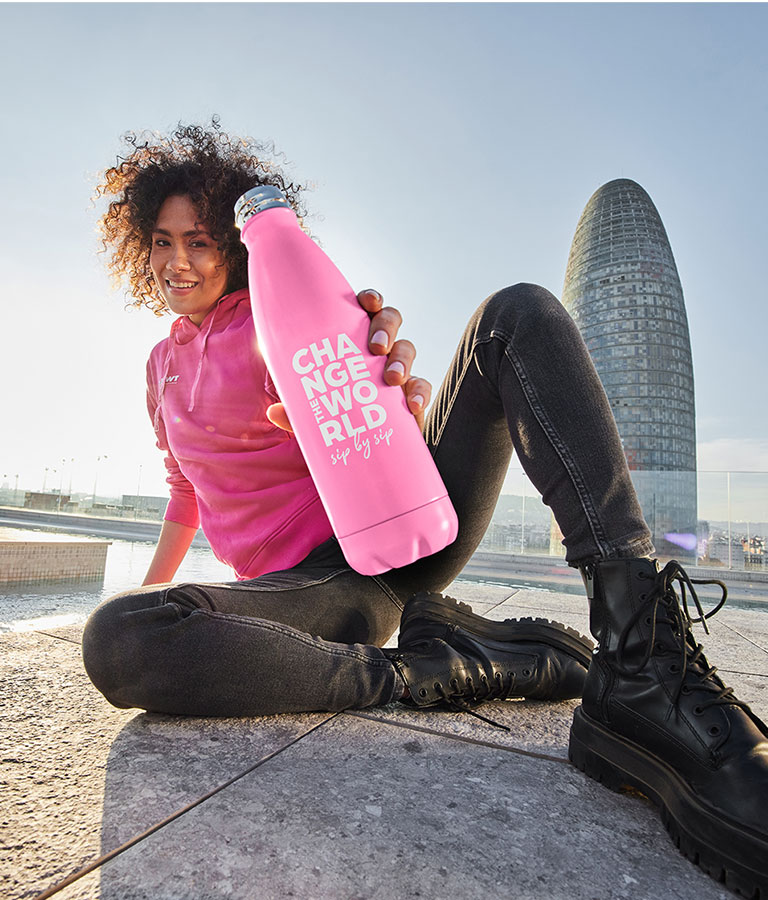
PINK DRIVING CHANGE
BWT teams up with Phantom Global Racing for Porsche Carrera Cup Asia debut.

BWT and Alpine extend their dynamic partnership with the Alpine Academy into the fast lane of 2024
BWT and Alpine extend their dynamic partnership with the Alpine Academy into the fast lane of 2024.

BWT RUN For You and Planet Blue
Join our RUN CHALLENGE from May 13th to May 26th and set a visible pink sign of support!

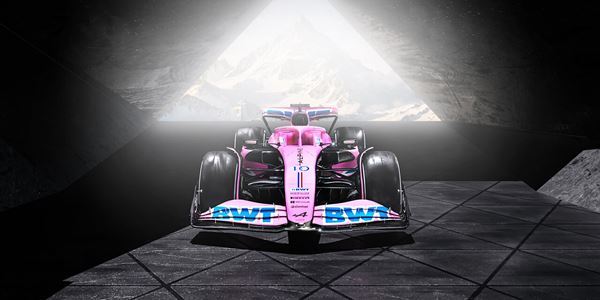
BWT Alpine F1 TEAM:
PINK REVS UP IN 2024
Demonstrating our unwavering commitment to sustainability and innovation, vibrant PINK is gearing up again in 2024. Together with the BWT Alpine F1 Team we are leaving our mark not only on the tracks but in every strategic decision we make.

BWT and Chemours officially launch THE Mobility F.C. Membranes Company GmbH – A BWT Chemours Company
FUMATECH, a technological pioneer in electrochemical application fields such as water treatment and energy-related applications, launched operations together with Chemours of their joint venture.
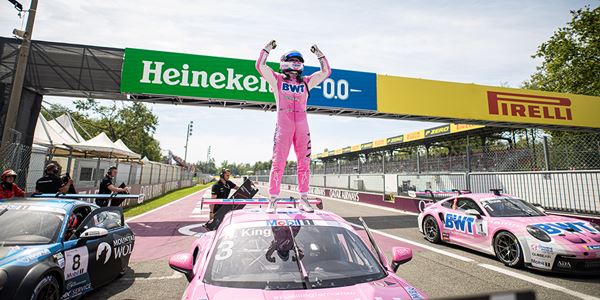
We are the Champions - Bastian Buus and BWT Lechner Racing on top!
BWT Lechner Racing, our strategic and long-term partner, is champion in 2023.
The pink color symbolizes BWT's mission to "Change the World – Sip by Sip". BWT Lechner Racing isn't just partaking in races, but also in a revolution. The strategy is...
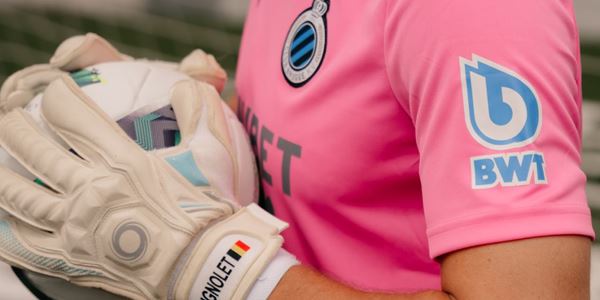
FC Brugge sets a further sign for sustainability and goes PINK!
BWT is now also becoming the official water partner of top European club, FC Brugge. The strategic partnership between Club Brugge and BWT stands for sustainable drinking water supply in the entire Jan Breydel stadium area, as well as the training...
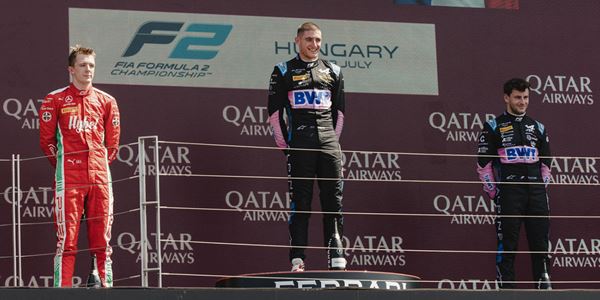
Podium hat trick for Alpine Academy as FIA Formula 2 and FIA Formula 3 race in Hungary
Five Alpine Academy drivers lined up on the grid this weekend with Jack Doohan (Invicta Virtuosi) and Victor Martins (ART Grand Prix) racing in Round 10 of the FIA Formula 2 Championship and Gabriele Minì (Hitech), Nikola Tsolov (ART) and Sophia...
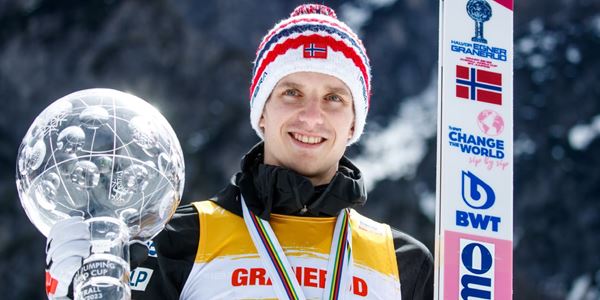
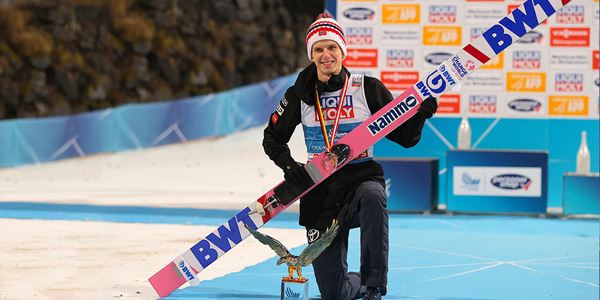
Halvor Egner Granerud made the 2022/23 ski jumping season pink!
This year's ski jumping World Cup season says goodbye with a PINK victory from the 26-year-old Norwegian ski jumper Halvor Egner Granerud, who was hard to beat this season.

The new LASK Arena is free of disposable plastic bottles
On Friday 24.02.2023, just 16 months after the construction start, the opening of the Raiffeisen Arena - the new home of LASK - took place. The color PINK plays a major role!
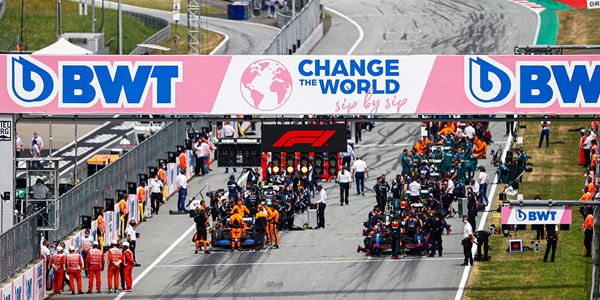
BWT Alpine – pink is back on track again!
The Formula 1 racetracks will shine in BWT pink again in 2023. Both in the design of the F1 bolides, as well as in their strategic actions, the two companies BWT and Alpine, again set a clear sign for sustainability with the color PINK.
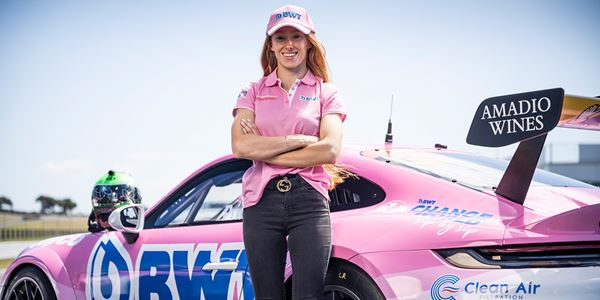
Our pink BWT sports family continious growing and goes overseas to Australia!
We are proud to announce another sponsoring partnership. From 2023 onwards, the Australian motorsport team - Porsche Centre Melbourne Motorsport - will be racing with female racer Courtney Prince in pink!
BWT turns Four Hills Tournament 2022/23 completely pink
The BWT athletes Halvor Egner Granerud (NOR) and Dawid Kubacki (POL) deliver a double podium. The pink brand celebrates the tournament again after Ryoyu Kobayashis victory in 2021/22 and Kubackis 2019/20.

BWT donates € 100,000 to Licht ins Dunkel
Christmas is the most reflective time of the year, it is the celebration of love and care - for family, friends, but also for those who are less fortunate in life. To support them in particular, BWT is once again this year donating 100,000 euros to a...
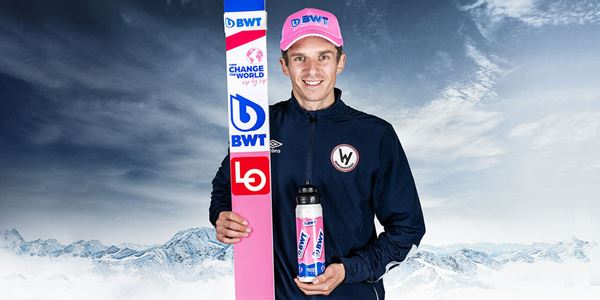
World-class jumper Granerud now also jumps in pink in the new season!
The sports family of the water treatment expert BWT continues to grow and welcomes the Norwegian ski jumper Halvor Egner Granerud, a top contender for this year‘s World Cup and 4-Hills Tour victory.

Proud winner of the "Sponsor of the Year" Award!
On Thursday, 13. October 2022, BWT's sporting commitment was honoured by the expert jury of the renowned German media portal HORIZONT.

BWT and ALPINE F1 team combine forces in strategic partnership aimed at sustainability drive
Alpine F1 Team and BWT, one of the leading suppliers of water treatment systems worldwide, are delighted to announce a strategic, long-term partnership. BWT becomes the title partner of Alpine F1 Team from the 2022 season onwards, with the team becoming...
BWT becomes official Water Technology Partner of Formula 1
BWT plans to make the paddock free of single-use plastic bottles by 2025


Andreas Weißenbacher at the Austrian World Summit 2020
BWT as premium partner at the climate conference of Arnold Schwarzenegger
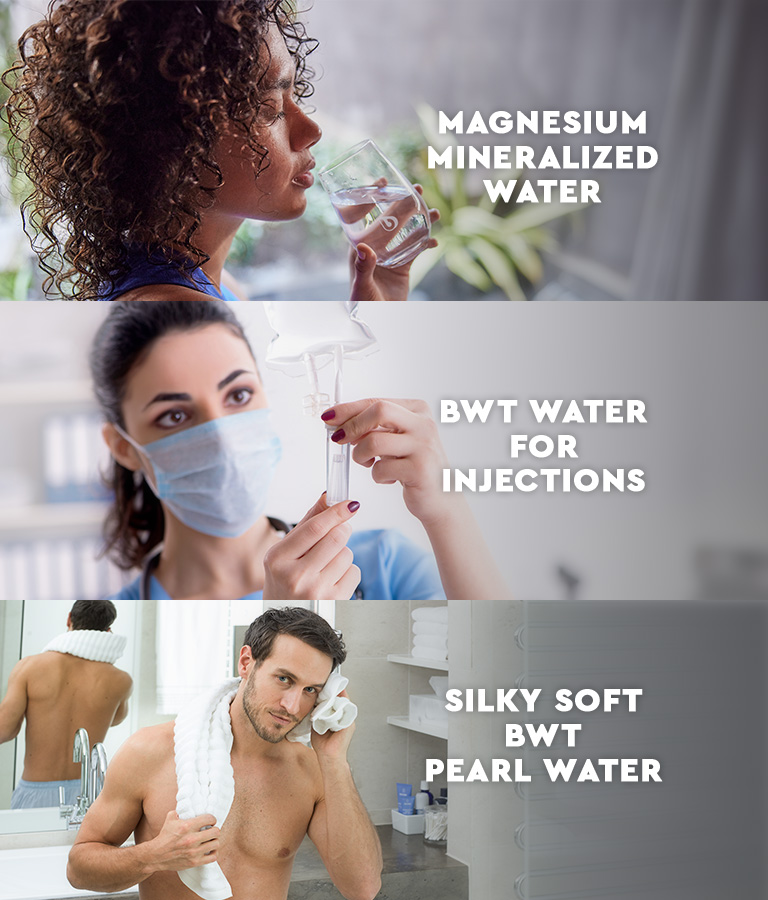
BWT Products
BWT offers a wealth of innovative products and technologies for a wide range of applications, all meeting the water quality needs of private households, industrial sites, public facilities, swimming pools, the Hotels & Hospitality sector and hospitals. You’ll find BWT wherever you come into contact with water, whether it’s clean, soft-to-the-touch water at home, water to enhance the taste of food in restaurants, or presented in the form of hydrogen as a future energy source.